In many of his presentations to participants at the ASA Practice Management Seminars, Dr. Amr Abouleish often suggested the following three levels of American healthcare. In fact, these were basically his leitmotif for understanding practice management.
Healing is an art. Medicine is a science. Healthcare is a business.
Anesthesia training programs focus extensively on the first two, but economic realities make it imperative that practices come to terms with the third. The greatest challenge facing most American anesthesia practices today is to generate enough revenue to recruit and retain a sufficient number of qualified providers to meet the expectations and contractual requirements of the administrations they serve.
It has been said that the effective management of the operating room suite can be compared to sitting on a three-legged stool where administration represents one leg, the surgeons the second leg and anesthesia the third. While there may be a close working relationship between administration and anesthesia, the relationship between administration as customer and surgeons as providers can be somewhat mercurial, which often leaves the anesthesia department captive to challenging, inconsistent and unpredictable staffing and call requirements. It should be obvious that the overall objectives of the administration and the anesthesia department are aligned; both want optimal productivity and reasonable profitability, but this is not always clear. The fundamental problem is that surgeons only use operating rooms as they need them. Fortunately, hospital administrators are starting to welcome input from the anesthesia department to explore options for more effective O.R. management. Some forwardthinking anesthesiologists such as Michael Roizen, MD of Chicago have been suggesting that anesthesia should play a much more active role in the management of the operating rooms. There is clearly an opportunity for anesthesia departments to share insights gleaned from their comprehensive billing database.
Limited personal experience often conditions anesthesia perceptions of surgeon behavior and motivation. The reality is that a detailed assessment of one surgeon’s goals and objectives is just that: an assessment of one surgeon’s practice. Every practice is a unique reflection of the personality of the surgeon, the nature of his or her specialty, economics and the requirements and expectations of the community. Some anesthesia providers have been tempted to generalize based only on their personal experience with surgeon behavior. While there is always some truth to these perceptions, as is often the case, most generalizations are simply not true. Understanding the complex factors that determine surgeon behavior is the key to the development of effective management strategies. As we all know, managing surgeon behavior can be a challenging business, but no single set of providers has more experience and more powerful data tools than those in anesthesia.
Obviously, the pandemic had a dramatic impact on American medicine. From March 2020 to the end of that year, hospitals adopted a wide variety of strategic measures to mitigate the potential impact of the virus. Many suspended the scheduling of elective cases for a period of time, which had a dramatic impact on surgeons and anesthesia providers. The good news is that, by the end of 2021, most facilities had returned to normal and surgical case volume was at or above pre-pandemic levels. Now is an especially good time to identify significant patterns and trends and formulate new strategies for the future. As a result, the focus of this analysis is the surgical activity of 10 significant anesthesia practices during calendar year 2022. The basis of our analysis is date of service (DOS) billing data from multi-site practices across the country. The goal was to identify those unique measures and metrics that anesthesia providers have access to as a result of their billing database that are especially useful in understanding the practices of their surgical colleagues. Because the focus is surgical activity in the operating room, we have excluded obstetric and endoscopic cases. The data does, however, include all types of surgical venues, including inpatient and outpatient venues.
As one can imagine, the resulting dataset is huge. Even relatively small facilities might have a list of hundreds of surgeons who book cases. Given the fact that 20 percent of surgical practices typically generate at least 80 percent of surgical cases, we have focused on the top surgical practices that are most responsible for overall operating room utilization and trends. One of our client practices, for example, provides services to 963 surgeons, of which 202 generate 80 percent of total surgical case volume. We have further refined our focus to the top 20 surgeons for each anesthesia practice because for most practices the top 20 surgeons generate 30 percent of total surgical revenue. The goal here is to provide templates and models that will allow the typical practice to better understand the strengths and weaknesses of their surgeon community in measurable and comparable economic terms.
CRITICAL METRICS
The three most important questions to ask when assessing a given surgeon’s practice are as follows.
- How important is the surgeon to the anesthesia practice? What percentage of cases is the surgeon responsible for and what percentage of total surgical revenue does this generate? Surgeon loyalty is also a critical factor. How likely is the surgeon to continue current levels of productivity?
- How productive is the surgeon? Does he or she generate a full line up of cases each day such that anesthesia can count on productive days of at least 50 billed ASA units per day, and is there a fair amount of down time? Most surgeons want their 7:30 starts, but how often is there a lineup of cases to follow?
- What is the impact of payer mix? Payer mix is the key to profitability. The higher the percentage of Medicare and Medicaid units billed, the lower the average yield per billed unit.
Tracking surgeon production patterns can prove to be an interesting exercise that requires some practice and attention to detail. The ability to consistently extract meaningful data may require some refinement and experience. Ultimately, the goal is to be able to determine the profitability of the top surgeons’ practice by comparing the cost per anesthetizing location day and its revenue potential.
THE TOP 20 SURGEONS
It is always helpful to identify the top 20 surgical practices. Table 1 presents the data for one of the sample practices. The top 20 surgeons were determined based on case count, which is perhaps the most common units of measure for surgical volume. The total billed units are one indicator of anesthesia revenue potential. The collections represent what has actually been collected and posted for the surgeon based on the date of service (collections are matched to the charges they are paying off).
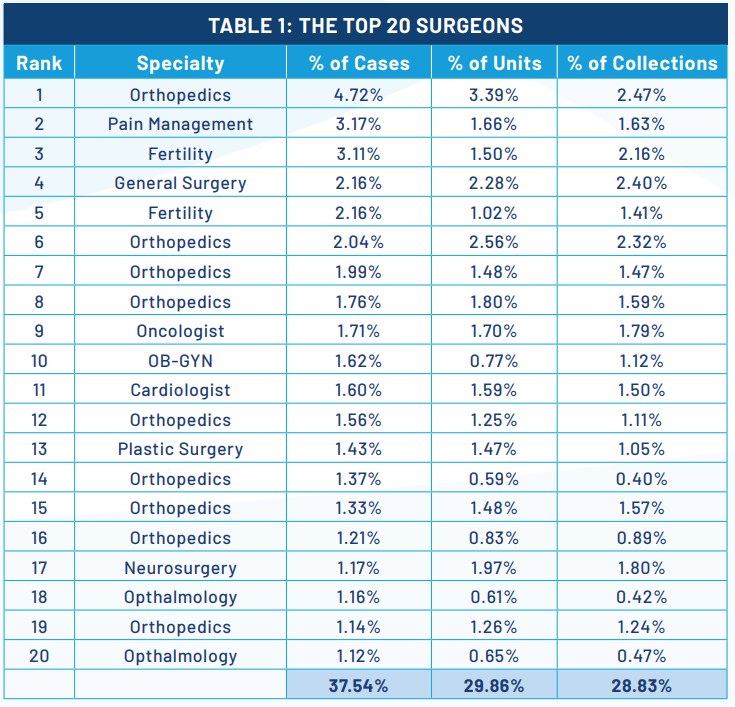
This table is quite representative of all the sample practices in the fact that the majority of surgical practices in the top 20 are orthopedics. These inevitably rise to the top of the list for two reasons: a majority of their patients have commercial insurance that pays at premium rates and many orthopedic anesthetics involve the use of nerve blocks for which there is separate payment. Of particular note in this table is the relationship between the percentage of cases and the percentage of total collections. This is a clear indication of the profitability of the practice. Neurosurgery, for example, involves fewer but longer cases, which makes it more profitable. When the percentage of collections is at or above the percentage of cases it indicates a very profitable surgical practice. It should be noted by contrast that eye surgeons do mostly Medicare cases so their percentage of collections is well below the percentage of cases.
SURGEON PRODUCTIVITY
There are two kinds of surgeons in most hospitals. There are those that bring most of their surgical cases to the facility and who have a good relationship with administration. These are the loyal ones that often get special favors from the facility. It is not uncommon, for example, to have a hospital build a separate wing for a busy orthopedic practice. The significance of these surgeons to the success of the facility and the anesthesia practice cannot be overstated. The irony is that, for the most part, anesthesia providers are more responsible for the quality of the patients’ surgical experience than the surgeons. While it used to be that anesthesia providers were primarily focused on the comfort and safety of their patients, administrators are increasingly focused on customer service; in other words, they want surgeons to feel well treated and well cared for.
Giving surgeons block time is the most common form of recognition facilities grant their favorite surgeons. This is one of the most common tools facilities use to encourage surgeon loyalty. The question, of course, is how consistently each uses his or her block time. Block time can only be an effective tool when it is managed closely.
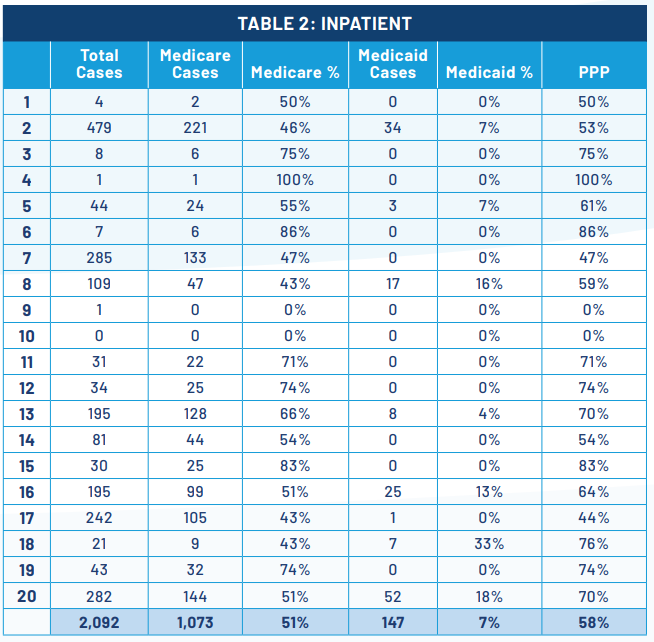
Table 2 Inpatient and Table 3 Outpatient, provide an example of useful metrics for evaluating surgeon productivity. While the operating room staff is usually focused on the number of cases a surgeon performs per day, what is far more useful and relevant to the anesthesia department is the average number of billable units generated. Billable units are a function of average cases per day multiplied by the average units per case. The data indicates how much variability there is among practices. The key metric here is the number of billable units generated per clinical day. Conventional wisdom holds that a provider needs to generate at least 50 ASA units paid at a reasonable average rate to cover the cost of providing the care.
THE IMPACT OF PAYER MIX
There are two realities that are continuing to challenge all medical practices in the United States. They are the aging American population and the increasing percentage of patients who are covered by Medicare and Medicaid, the rates for which are set by federal and state governments, and not the market. Most practices are seeing a one percent increase in their Medicare population per year. Medicaid percentages are also increasing for many, but for different reasons having to do with the local economy. The average Medicare rate is about $22 per ASA unit while many commercial rates can be as much as $60 per unit. Medicaid rates vary considerably from state to state but are most discounted in the Empire State where New York Medicaid only pays $10 per unit.
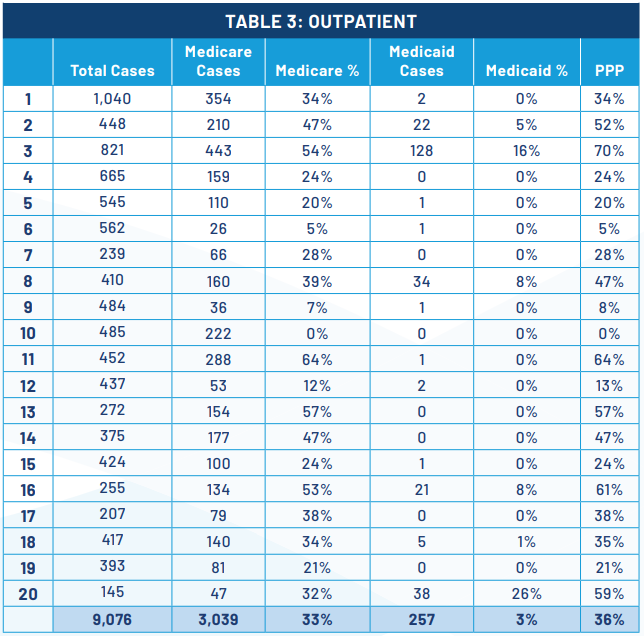
Table 2 Inpatient and Table 3 Outpatient, provide examples of the analysis of payer mix by place of service. First, it should be noted that for the anesthesia practice from which this data comes, 81 percent of all cases for the top 20 surgeons were performed on an outpatient basis in 2022. Understanding why cases are performed on an outpatient basis versus in a hospital is a function of many factors most of which relate to the convenience of the patient and the surgeon. Clearly, it is easier to book a case in a surgery center than in a traditional hospital. For the patient, access is also much easier. There is a belief in some practices that surgeons may tend to book their Medicare cases in the hospital while they take their patients with good insurance to outpatient facilities. While this may be a factor for some surgeons, it is not the primary consideration.
In Tables 2 and 3, Medicare and Medicaid cases are broken out. This allows for the identification of a Medicare percentage and a Medicaid percentage. The combination of the two is referred to as the public payer percentage, noted here as the PPP. It is certainly true that the PPP is higher for inpatient cases than outpatient, 58 percent versus 36 percent, but it should be noted that there is considerable variability from surgical practice to surgical practice.
Not only is a smaller percentage of Medicare cases performed in outpatient facilities, but this is also true of Medicaid cases: seven percent inpatient versus three percent outpatient. Obviously, payer mix has a significant impact on the revenue potential by place of service: the yield per unit billed will inevitably be higher for cases performed on an outpatient or ambulatory basis. Over the past years, there has been an inexorable migration of cases from inpatient facilities to outpatient facilities. Increasingly, cases that were once considered inpatient procedures are being reclassified as outpatient procedures.
The implications of this migration have dramatically impacted virtually all anesthesia practices in a number of significant ways and are the result of market factors over which the anesthesia practice has little or no control. Perhaps the most important impact is on coverage and call requirements. Even though cases are migrating out of traditional hospital facilities, the coverage and call requirements have remained much the same. The result has simply been that the economics of hospital care has been eroding. The profitability of 24-hour in-house call coverage is constantly eroding as a result of volume and payer mix trends. This inevitably leads to the need for increased financial support to maintain the same level of service. It comes as no surprise that anesthesia subsidies have increased dramatically over the past decade. In many markets, anesthesia practices are even starting to find they need financial support in ambulatory facilities.
It is also true that anesthesia practices have had to reinvent themselves. The days of a large practice dedicated to just one primary facility are fading fast. The typical practice is spending considerably more time and energy expanding its scope and focus to follow their surgeons to the venues they prefer to do their cases. The result is a new practice model that is based on the new logistical realities of practices that must be able to deploy providers to a variety of venues.
YIELD PER CLINICAL DAY
Every anesthesia practice that must renegotiate its contract with its hospital administrators must assess the profitability of the agreement. This inevitably involves comparing the revenue potential of the clinical services provided with the cost of providing the care. While there are a variety of ways to perform this analysis, many prefer to normalize the calculations based on anesthetizing locations because this facilitates discussion of coverage options. Requirements for this approach require two practice-specific metrics: the cost per anesthetizing location per day and the revenue potential of the average clinical day. Tables 4 and 5 are provided to shed light on two aspects of the calculation of the revenue potential. The first presents the average daily yield potential per day for the top 20 surgeons for each of the anesthesia practices in our sample. This offers benchmark data as a point of reference.
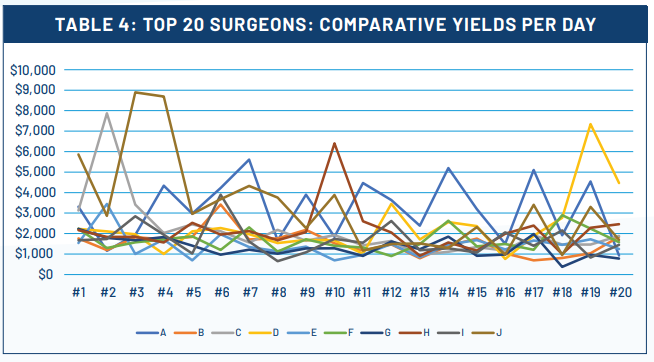
Table 5 shows actual metrics for the top 20 practices for a typical anesthesia practice. Ideally, this should be prepared for your practice as a way of identifying how each surgeon achieves his or her results. As has been discussed, every facility offers privileges to an extensive list of surgeons, but it is usually the top 20 percent that generate 80 percent of the cases and revenue. It is because of this that every anesthesia practice must ensure that the top surgeons are as productive as possible.
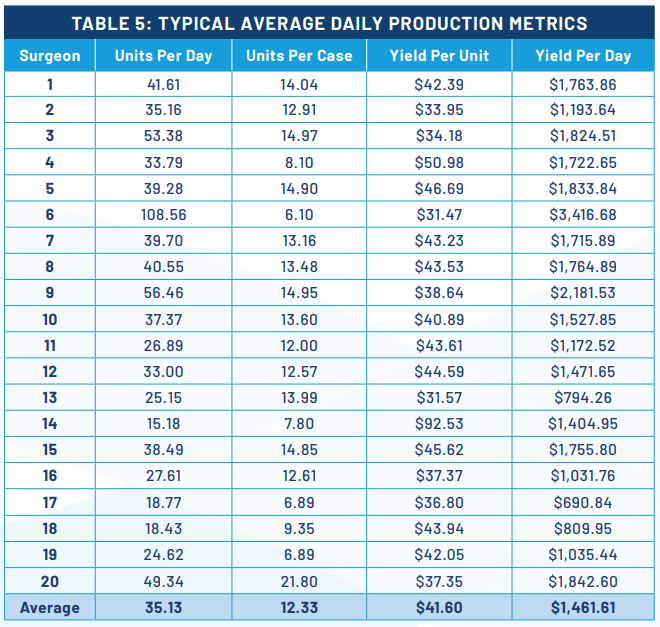
Typically, the average daily yield for the top surgeons should be $2,000. As the chart indicates, there are a number of notable exceptions, but they are clearly outliers. The concern is that all the rest of the surgeons yield much less per day. The actual cost of providing the care will vary considerably based on the configuration of the care team and compensation levels. The point is that for most practices there is simply not enough revenue generated from patient collections to cover the cost of the care required; this explains why most practices require financial support.
Table 5 shows the critical production metrics that determine the yield per clinical day. The actual formula multiplies the number of cases per day by the average units per case by the actual net yield per unit. Some surgeons perform more cases with fewer units per case, as is true of endoscopists whose average case only generates about six or seven units, while others perform fewer longer cases. The yield per unit can be a big differentiator. Cardiac surgeons, for example, perform long cases that generate 40 to 50 units per case but because these are mainly Medicare patients the yield per unit is limited by discounted Medicare rates and so their yield per day may also be low.
QUALITIES OF THE BEST SURGEONS
The best surgeons typically embody the following, and these are qualities that anesthesia providers should look for and encourage as part of their commitment to excellent customer service.
- Top surgeons understand and appreciate the value of anesthesia and are always open to collaborative approaches to the management of their patients. They recognize the importance of quality anesthesia care. There is no better example of this than orthopedic surgeons that encourage the use of nerve blocks for post-operative pain management.
- The best surgeons are loyal to the institution and consider themselves partners with administration. There is no greater challenge to anesthesia practices than surgeons who might decide to take their cases elsewhere. Anesthesia needs to be able to count on consistent surgical volume.
- O.R. utilization can be very significant. When surgeons insist on 7:30 starts, the hope and the expectation of the anesthesia providers is that they will get the to-follow cases. Everyone likes full days of cases without significant gaps. Nothing is more challenging than the surgeon who schedules a couple of cases in the morning then goes to his office, only to bring one or two add on cases late in the day.
- The acuity of care, as measured in average units per case, can be especially relevant. The relationship between the anesthesia providers and each surgeon is greatly enhanced when there is a certain degree of predictability with regard to the types of cases performed and anesthetic requirements.
- Although quality of care has nothing to do with a patient’s insurance or ability to pay, as mentioned at the outset, healthcare is a business. Payer mix and financial yields are always important aspects to monitor and track. The more surgeons that have productive and profitable practices, the less support that will be needed from the facility.
FINAL THOUGHTS
One might wonder how the data and concepts presented here will help the typical anesthesia practice that sees itself captive to a system over which it has no control. For many practices, the information and analysis presented here might simply provide an entertaining confirmation of their current perceptions of the surgical practices they work with daily. To those who are willing to give this information serious consideration, however, there are a variety of possibilities. This article is dedicated to the spirit of partnership that most administrations are now seeking with their anesthesia providers. Building on the themes of accountability, collaboration and innovation, these data and metrics can prove relevant on at least three levels.
First, the sharing of timely and reliable data is a necessary prerequisite to collaboration. Maybe the administration has drawn many of the same conclusions about its surgeons as the anesthesia team, but maybe not. Maybe they only see part of the picture and are limited by the requisites of hospital administration. There is always great value in helping administrators understand and appreciate the specific economics of anesthesia. This can only be helpful, especially when it comes to the negotiation of a stipend.
Second, the anesthesia providers are critical stakeholders in the management of the operating rooms. The data and insights gleaned from their billing system offer a unique set of opportunities and insights for process improvement. No one has more and better information about how surgeons actually work and what makes them more or less efficient. The challenge and opportunity for all anesthesia practices is to take more control of the factors that determine their income and lifestyle.
Drilling down on surgeon behavior is the next level of involvement for most anesthesia practices. It is one thing to know what the collections are and what the impact of payer mix is, but it is quite another to know where the surgical cases are coming from and how important surgeon loyalty is to the future of the practice. Not only will the kinds of information presented here be of interest to your administrators, but sharing them will open up a whole new level of dialogue and partnership.
Jody Locke, MA serves as Vice President of Anesthesia and Pain Practice Management Services for Coronis Health. Mr. Locke is responsible for the scope and focus of services provided to Coronis Health’s largest clients. He is also responsible for oversight and management of the company’s pain management billing team. He is a key executive contact for groups that enter into contracts with Coronis. Mr. Locke can be reached at jody.locke@coronishealth.com.
